Easy Solar SoLink
With our exclusive ESS system configurator based on Google Maps and Google Solar API satellite technology, you can configure the photovoltaic system directly on the roof of the property it is intended for. The step-by-step instructions of ESS will guide you through an intuitive and easy-to-use program for your projects, from which you can download all the data related to configuration, expected performance simulation, and much more. The use of ESS is free, and this first version is enabled for all pitched roofs, soon an upgrade will be available for flat roofs as well. ESS technology is continuously evolving with the goal of saving you time in site visits and design.
Key Points
Discover what you can do with SoLink products
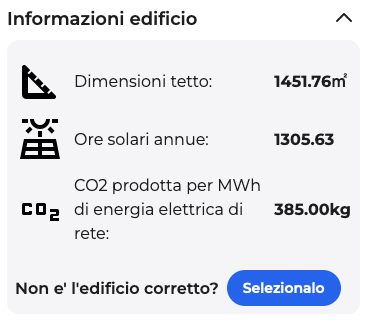
View Building Information
- View the total area of the roof
- View average sunlight hours expressed in 1 hour of sunlight = 1 kWh per kW
- Equivalent amount of CO2 produced per MWh of grid electricity. This is a measure of the carbon intensity of grid electricity displaced by solar electricity
View Roof Information
- View the roof pitches in order (South, East, West, North)
- View the area, slope, exposure, and height above sea level of individual pitches
Measure the Roof Pitches
Through the editor, you can trace the perimeter of the selected pitch, discover its measurements, and select its main gutter.
Chimney
Red
Area: 2.30m2
Perimeter: 6.23m
Excluded Area
Green
Area: 2.51m2
Perimeter: 6.90m
Exclude chimneys or areas where panels should not be present
Through the editor, you can remove areas of the roof where panels cannot be placed. It is possible to name excluded sections and assign a color to make them recognizable on the map.
Discover how many panels can be installed on the pitch
It is possible to select the arrangement of the panels, whether vertical or horizontal, and draw them on the selected pitch within the perimeter expressed considering the chosen panel in configuration and the excluded zones. Once drawn, the maximum number will be returned, and it will be possible to decrease them.
Example of configuration chart
View a system performance simulation
Once the work with the editor is completed, you can view a performance simulation for the selected area with the selected panels. You can revisit the system summary via a link, download the PDF, or send an email with the configuration to the sales office to receive a quote.
View example simulation